
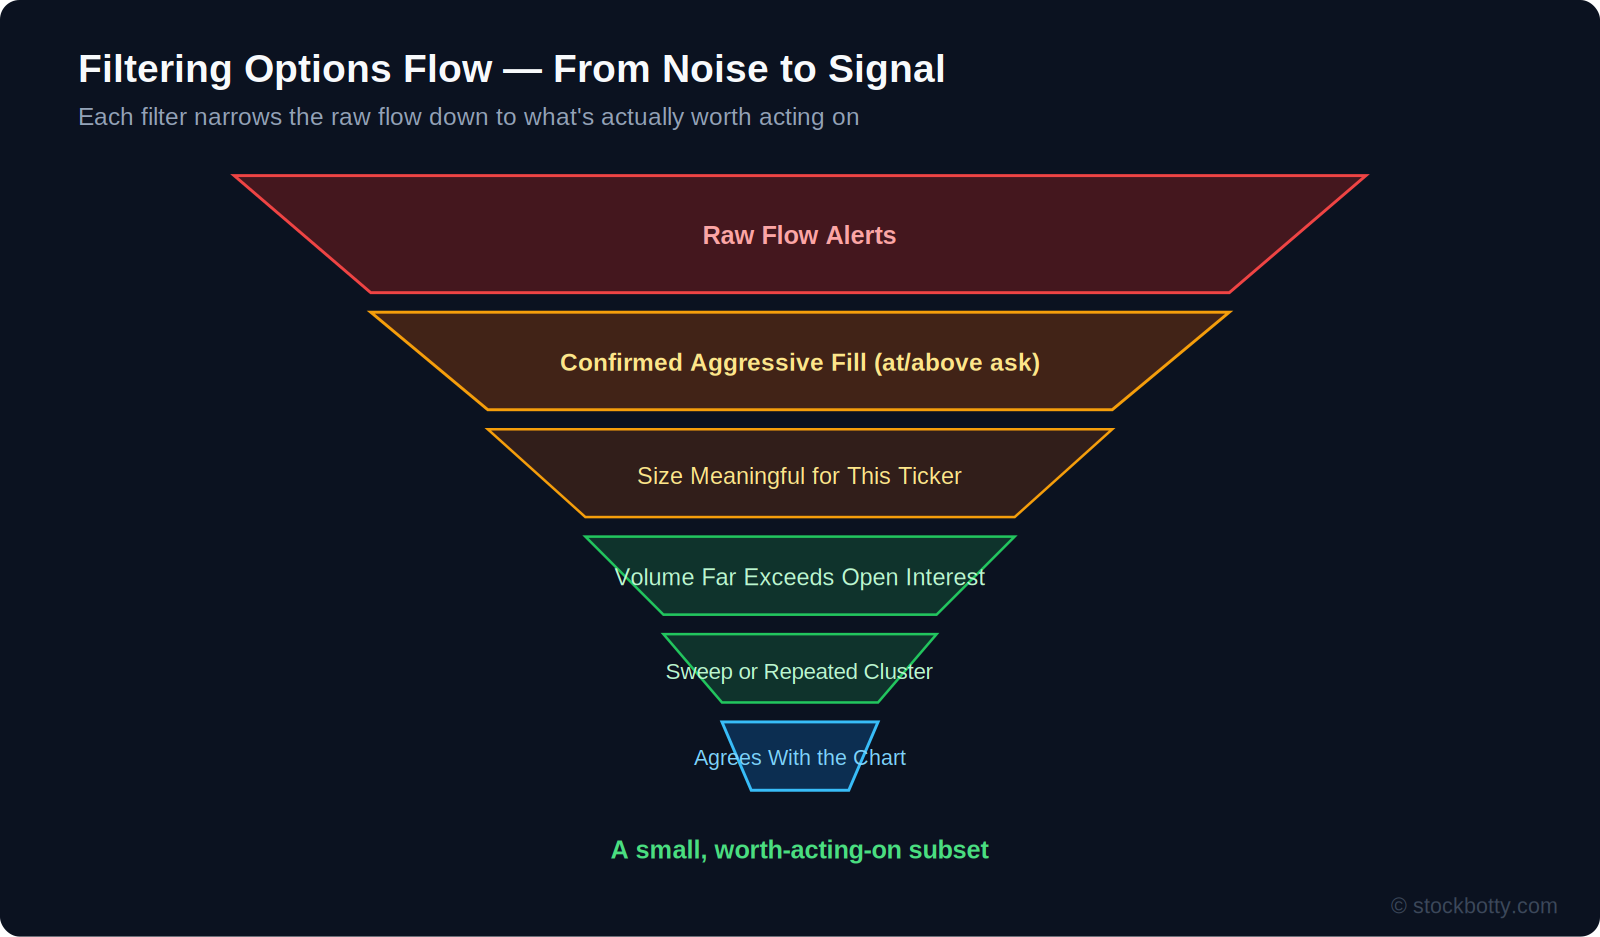
A colorful “unusual options activity” screenshot is easy to find and easy to misread. Large trades happen for many reasons that have nothing to do with a directional bet – hedging, spread legs, rolling, and existing positions being closed all produce large prints too. This page covers the filters worth applying before treating any single flow alert as meaningful, narrowing a large volume of raw activity down to the small subset actually worth paying attention to.
Why Most Flow Is Noise
Institutions and large traders are aware that their activity is being watched, and a meaningful share of what shows up on a flow screener isn’t a fresh directional bet at all. A large print can just as easily be a hedge against an existing position, one leg of a multi-leg spread that looks unusual in isolation, a position being rolled to a new strike or expiration, or simply someone exiting a trade rather than entering one. Size on its own, without additional context, doesn’t distinguish between these.
Confirming Aggressive Intent: Fill Price Relative to the Bid-Ask
Most flow data providers tag where a trade filled relative to the bid-ask spread at the time. A trade that fills at or above the ask generally indicates a buyer who was willing to pay the full quoted price, or more, rather than wait for a better one – a meaningful signal of urgency that plain trade size doesn’t capture on its own. A trade filling at or below the bid suggests the opposite dynamic, a seller willing to accept a lower price to get filled quickly. Without this detail, a large trade could just as easily be a passive fill, a spread leg, or an existing position being closed, none of which necessarily reflect fresh directional conviction.
Size Only Makes Sense in Context
A given dollar amount means very different things depending on the underlying. A large notional order on a mega-cap stock with enormous daily options volume can be unremarkable; the same dollar amount on a thinly-traded small-cap can represent genuinely unusual activity. Evaluating size relative to that specific ticker’s typical options volume and its usual liquidity is more informative than looking at the raw dollar figure in isolation.
Volume vs. Open Interest
The distinction between volume and open interest, covered in more detail in the reading an option chain guide, is one of the more useful filters here and one that’s easy to apply incorrectly. Volume that’s small relative to existing open interest generally reflects contracts changing hands between traders who already held positions – closer to churn than fresh conviction. Volume that’s a large multiple of existing open interest is a stronger indicator of new positioning. Confirming this the next trading day, by checking whether open interest actually increased, helps distinguish between volume that represented new positions being opened versus existing positions being closed out.
Execution Pattern: Sweeps, Blocks, and Clusters
- Sweeps – orders broken up and routed across multiple exchanges simultaneously to fill quickly – generally reflect urgency, since the trader is prioritizing speed of execution over price.
- Single blocks can reflect genuine conviction, but can just as easily be a negotiated institutional trade with a hedging purpose that has little to do with a directional view on the stock.
- Repeated prints on the same ticker, same side, similar strikes and expirations, spread over a period of time, look more like deliberate accumulation than a single random trade – a pattern worth more weight than any one print in isolation.
Matching the Flow’s Timeframe to the Trade Being Considered
Flow shows up across every expiration, from same-day and next-day contracts to LEAPS. Very short-dated flow – the kind that generates the most attention-grabbing screenshots – is often driven by short-term speculation with a low probability of success and little relevance to a trader working on a longer time horizon. Matching the expiration of the flow being observed to the trader’s own intended holding period, rather than reacting to whatever expiration happens to be trending, keeps the signal relevant to the actual decision being made.
Flow Is One Input, Not a Standalone Signal
Even flow that passes every filter above – a confirmed aggressive fill, meaningful size, a strong volume-to-open-interest ratio, a clear sweep or cluster pattern, and a matching timeframe – is still just one input. Weighing it against the broader technical picture (where the stock sits relative to recent support and resistance, and the underlying trend) is what separates using flow as a supporting signal from following unconfirmed prints on their own. When flow and the broader price structure disagree, it’s generally worth giving more weight to the chart than to the flow alone.
What to Filter Out
- “Most active” lists with no fill-price or aggression context attached.
- Unconfirmed large trades with no indication of whether they filled aggressively or passively.
- Trade sizes that are unremarkable once compared to the specific ticker’s normal options activity.
- Very short-dated, far out-of-the-money flow with no supporting technical context.
- Any single print treated as conclusive without checking volume against open interest, or the next day’s open interest change.
Frequently Asked Questions
Why is most options flow considered noise?
Because a large options trade can be many things besides a directional bet – a hedge, one leg of a multi-leg spread, a position being rolled, or an existing position being closed. Without confirming the details of a trade, size alone doesn’t indicate conviction.
What does it mean when an option fills at or above the ask?
It generally indicates an aggressive buyer, willing to pay the full ask price or more rather than wait for a better price. This is a stronger signal of urgency and directional intent than a trade filled at the bid or midpoint.
Why does volume relative to open interest matter?
Volume far exceeding existing open interest suggests a meaningful amount of fresh positioning rather than existing contracts simply changing hands. Checking whether open interest actually increased the next day helps confirm whether that volume represented new positions being opened.
What is the difference between a sweep and a block trade?
A sweep is an order broken up and routed across multiple exchanges simultaneously to fill quickly, generally signaling urgency. A block is a single large trade, which can reflect genuine conviction or simply be a negotiated institutional hedge with no particular directional signal.
Should options flow be used as a standalone signal?
It’s generally treated as one input among several rather than a standalone signal. Even flow that passes every filter can still be wrong, or represent hedging rather than conviction, which is why it’s typically weighed against the broader price structure and trend.